
BHP Billiton has released following update on production during year ended June 30th 2011
Highlights
1. Annual production records were achieved across four commodities and ten operations as a result of our strategy to invest throughout the economic cycle.
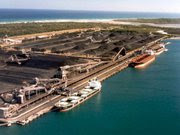
2. Eleventh consecutive annual production record achieved in Iron Ore while Western Australia Iron Ore shipments rose to an annualised rate of 155 million tonnes per annum in the June 2011 quarter (100%
basis).
3. Annual production and sales records for Hunter Valley Energy Coal (Australia) following the commissioning and ramp up of the MAC20 project and utilization of our Newcastle Coal Infrastructure Group (NCIG) port capacity.
4. The successful integration of the Fayetteville Shale (USA), combined with strong underlying performance from existing assets, delivered an increase in annual petroleum production, despite the ongoing impact of permitting delays in the Gulf of Mexico (USA). Annual production records were achieved for natural gas and at North West Shelf (Australia).
5. Copper production increased during the 2011 financial year as Olympic Dam (Australia) reported annual material mined and milling records. Strong operating performance was similarly reported at Pampa Norte (Chile) and Antamina (Peru), where record annual milling rates were recorded.
April to June quarter
| Category | Unit | Q'Jun'11 | YoY | QoQ |
| Crude oil & condensate | ('000 bbl) | 18,652 | -17% | -3% |
| Natural gas | (bcf) | 131.79 | 45% | 55% |
| Natural gas liquid | ('000 bbl) | 2,636 | -17% | 8% |
| Total Petroleum Products | (million boe) | 43.25 | 6% | 21% |
| Alumina (a) | ('000 tonnes) | 1,026 | 7% | 7% |
| Aluminium | ('000 tonnes) | 313 | 1% | 3% |
| Copper | ('000 tonnes) | 272.3 | -6% | 0% |
| Lead | (tonnes) | 58,578 | -7% | 13% |
| Zinc | (tonnes) | 34,733 | -24% | -14% |
| Gold | (ounces) | 45,545 | 29% | -8% |
| Silver | ('000 ounces) | 9,877 | -13% | 9% |
| Uranium oxide concentrate | (tonnes) | 1,015 | 43% | -5% |
| Molybdenum | (tonnes) | 418 | 55% | 25% |
| Diamonds | ('000 carats) | 576 | -22% | 5% |
| Nickel (b) | ('000 tonnes) | 38.2 | -16% | 16% |
| Iron ore | ('000 tonnes) | 35,526 | 14% | 7% |
| Manganese ore | ('000 tonnes) | 1,790 | 4% | 32% |
| Manganese alloy | ('000 tonnes) | 190 | -13% | 10% |
| Metallurgical coal | ('000 tonnes) | 7,922 | -28% | 19% |
| Energy coal | ('000 tonnes) | 18,338 | 13% | 5% |
July’10 to June’11 year
| Category | Unit | YTD'Jun11 | YTD'Jun10 | YoY |
| Crude oil & condensate | ('000 bbl) | 80,591 | 84,387 | -4% |
| Natural gas | (bcf) | 405.06 | 368.57 | 10% |
| Natural gas liquid | ('000 bbl) | 11,283 | 12,749 | -11% |
| Total Petroleum Products | (million boe) | 159.38 | 158.56 | 1% |
| Alumina (a) | ('000 tonnes) | 4,010 | 3,763 | 7% |
| Aluminium | ('000 tonnes) | 1,246 | 1,241 | 0% |
| Copper | ('000 tonnes) | 1,139.4 | 1,075.2 | 6% |
| Lead | (tonnes) | 244,554 | 248,486 | -2% |
| Zinc | (tonnes) | 152,127 | 198,279 | -23% |
| Gold | (ounces) | 196,091 | 141,919 | 38% |
| Silver | ('000 ounces) | 42,656 | 45,362 | -6% |
| Uranium oxide concentrate | (tonnes) | 4,045 | 2,279 | 77% |
| Molybdenum | (tonnes) | 1,445 | 813 | 78% |
| Diamonds | (000 carats) | 2,506 | 3,050 | -18% |
| Nickel (b) | ('000 tonnes) | 152.7 | 173.4 | -12% |
| Iron ore | ('000 tonnes) | 134,406 | 124,962 | 8% |
| Manganese ore | ('000 tonnes) | 7,093 | 6,124 | 16% |
| Manganese alloy | ('000 tonnes) | 753 | 583 | 29% |
| Metallurgical coal | ('000 tonnes) | 32,678 | 37,381 | -13% |
| Energy coal | ('000 tonnes) | 69,500 | 66,131 | 5% |


No comments:
Post a Comment